
Ship Model Testing in Towing Tanks
Scale Effects, Uncertainty, and CFD Validation
How calm-water resistance tests are conducted, interpreted, and used to establish confidence in computational ship hydrodynamics
Key Takeaways
A towing-tank resistance test measures the force required to tow a geometrically scaled ship model through calm water while monitoring speed, sinkage, trim, and environmental conditions.
Froude similarity preserves the dominant free-surface wave physics, but Reynolds similarity cannot be maintained simultaneously; the resulting viscous mismatch is the core of the scale-effect problem.
Experimental results are incomplete without a documented uncertainty statement covering geometry, installation, calibration, direct measurements, repeatability, and data reduction.
A virtual towing tank must be verified for iterative, spatial, and temporal convergence before it can be validated against experimental data.
Credible validation extends beyond a single resistance value and should compare motions, wave patterns, pressure fields, and other independently measured quantities whenever data are available.
Experimental Fluid Dynamics (EFD) and Computational Fluid Dynamics (CFD) are complementary: EFD provides the physical reference, while CFD resolves the wider flow field and supports interpretation.
Article contents
- Why Ship Model Testing in Towing Tanks Still Matters
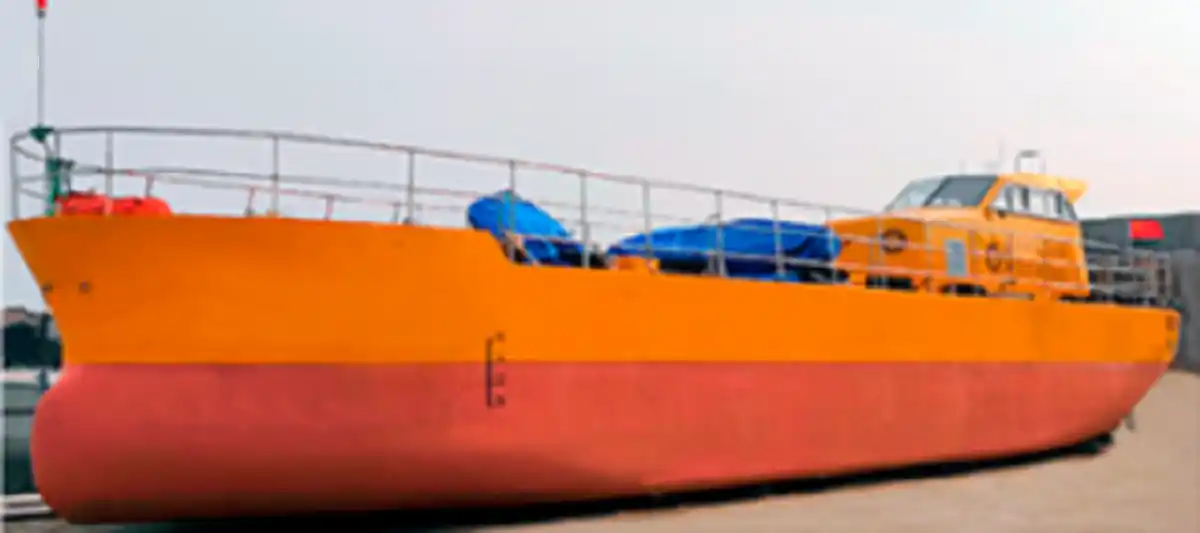
- From the Full-Scale Ship to the Physical Model
- Inside a Towing-Tank Resistance Test
- From Measured Force to Hydrodynamic Coefficients
- Why Scale Effects Cannot Be Eliminated
- Experimental Uncertainty: How Reliable Is the Test Result?
- Virtual Towing Tanks: Reproducing the Experiment in CFD
- Verification: Is the Numerical Solution Sufficiently Resolved?
- Validation: Does CFD Reproduce the Physical Test?
- Benchmark Hulls and Public Validation Data
- What the Current Evidence Shows
- Best-Practice Workflow for Calm-Water Resistance Prediction
- Conclusions
Why Ship Model Testing in Towing Tanks Still Matters
Ship model testing in towing tanks remains one of the principal experimental methods used to establish calm-water resistance for displacement vessels. Ship resistance governs the effective power required to advance the bare hull at a specified speed and strongly influences machinery selection, fuel consumption, operating economics, and the probability of meeting contractual speed requirements. An optimistic prediction may leave a vessel underpowered, whereas an excessively conservative prediction may produce an unnecessarily heavy and expensive propulsion plant. Within naval architecture, these measurements also provide an essential physical reference for assessing numerical predictions.
For more than a century, model-scale testing in towing tanks has provided the principal experimental route from a hull form to a resistance-speed curve. The modern test is not simply a matter of towing a small model and multiplying the measured force by a scale factor. Model manufacture, loading condition, towing arrangement, instrumentation, calibration, fluid properties, data acquisition, blockage, finite-depth effects, and uncertainty all influence the final result. The International Towing Tank Conference (ITTC) procedures formalise these elements and remain the primary methodological framework for resistance testing and its interpretation [1-4].
CFD has added a second route. Reynolds-averaged Navier-Stokes simulations can reproduce a virtual towing tank, predict integrated forces, resolve the free surface, and expose pressure, shear stress, velocity, turbulence, and vorticity fields that are difficult to obtain experimentally. Yet CFD is not automatically credible because it produces a detailed colour contour. Numerical error, modelling assumptions, boundary conditions, wall treatment, free-surface resolution, and convergence all require systematic assessment [5,6,8,9].
This OceanTechReview technical research review follows a traceable sequence: the physical model, the resistance test, conversion of measured forces into hydrodynamic coefficients, the unavoidable scale effects, experimental uncertainty, virtual towing-tank practice, CFD verification, and validation against open benchmark data. The scope is limited to conventional displacement hulls advancing in deep, calm water without active propulsors. Propeller open-water tests, self-propulsion, cavitation, manoeuvring, seakeeping, added resistance in waves, and sea-trial analysis are outside the main discussion.
From the Full-Scale Ship to the Physical Model
2.1 Geometric similarity and model scale
The first requirement of a towing-tank experiment is a geometrically similar model. If the geometric scale ratio is denoted by λ, the relationship between a representative full-scale length LS and the corresponding model length LM is
A scale ratio of 20 means that one metre on the model represents 20 metres on the ship.
All principal linear dimensions should follow the same ratio, including length between perpendiculars, waterline length, breadth, draught, appendage positions, and local hull-form features. Areas scale with λ² and volumes with λ³. In practice, geometric similarity is limited by manufacturing tolerances, the treatment of very small details, and the need to provide a smooth and stable test model.
The model should generally be as large as the facility can accommodate, because a larger model produces higher forces, a higher Reynolds number, and a better signal-to-noise ratio. However, increasing the model size also increases blockage and finite-depth sensitivity. The selected scale is therefore a compromise between viscous similarity, measurement resolution, available run length, carriage speed, tank cross-section, and model-handling constraints [1].
2.2 Manufacture, surface condition, and hydrostatics
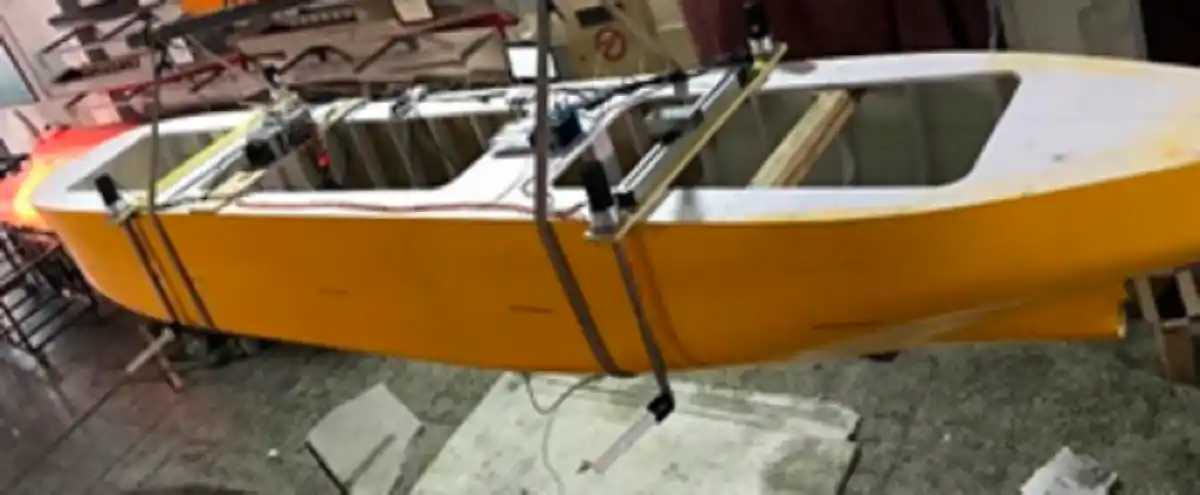
The manufactured model must reproduce the reference hull within documented tolerances. Surface fairness is especially important: local waviness or an unintended edge can modify pressure gradients and separation. The model surface should be clean and sufficiently smooth for the intended method, while the positions of the design waterline, forward and aft perpendiculars, centre of gravity, towing point, and instrumentation interfaces must be known.
Before testing, the model is ballasted to the specified displacement and adjusted to the target draughts and static trim. The measured mass distribution should place the centre of gravity and relevant inertial properties close to their intended values when the model is permitted to sink and trim freely. The model condition, loading case, wetted surface area, hydrostatic particulars, and turbulence-stimulation method should be recorded in the test report [1,2].
2.3 Turbulence stimulation
A full-scale ship operates at a Reynolds number far above that of a typical towing-tank model. Without intervention, part of the model boundary layer may remain laminar for an unrealistically long distance. A trip wire, studs, or another approved turbulence stimulator is therefore fitted near the bow to promote transition. Its size and location must be sufficient to trigger turbulence but should not generate excessive parasitic resistance. The chosen method becomes part of the model specification because it affects the measured force and the interpretation of the viscous component [1].
Inside a Towing-Tank Resistance Test
3.1 Facility and towing carriage
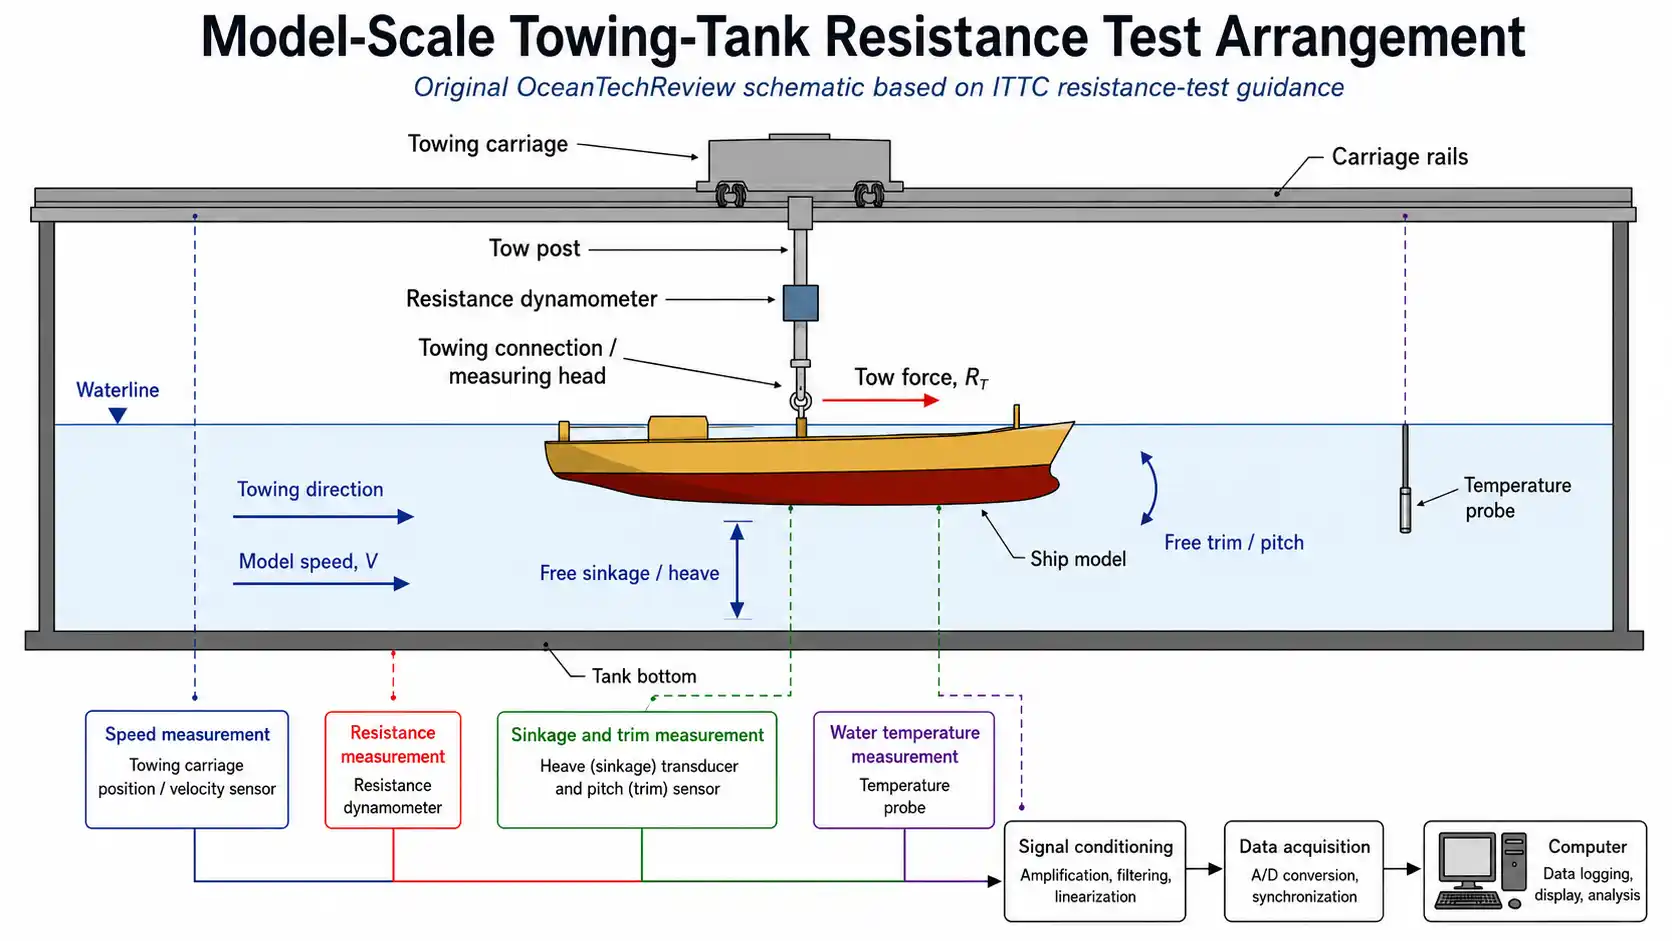
A conventional towing tank is a long, straight basin equipped with a carriage that travels above or alongside the water. The carriage accelerates the model to the prescribed speed, maintains a stable test interval, and then decelerates before the end of the run. The useful measurement window must be long enough for the force and motion signals to become representative, yet short enough to avoid contamination from end effects or reflected waves.
The facility dimensions matter. Tank width and depth determine the susceptibility to sidewall blockage and finite-depth effects. The length and carriage acceleration determine how much steady data can be collected. After each run, the facility may require a waiting period so that residual waves and recirculating currents decay before the next measurement.
3.2 Model installation and degrees of freedom
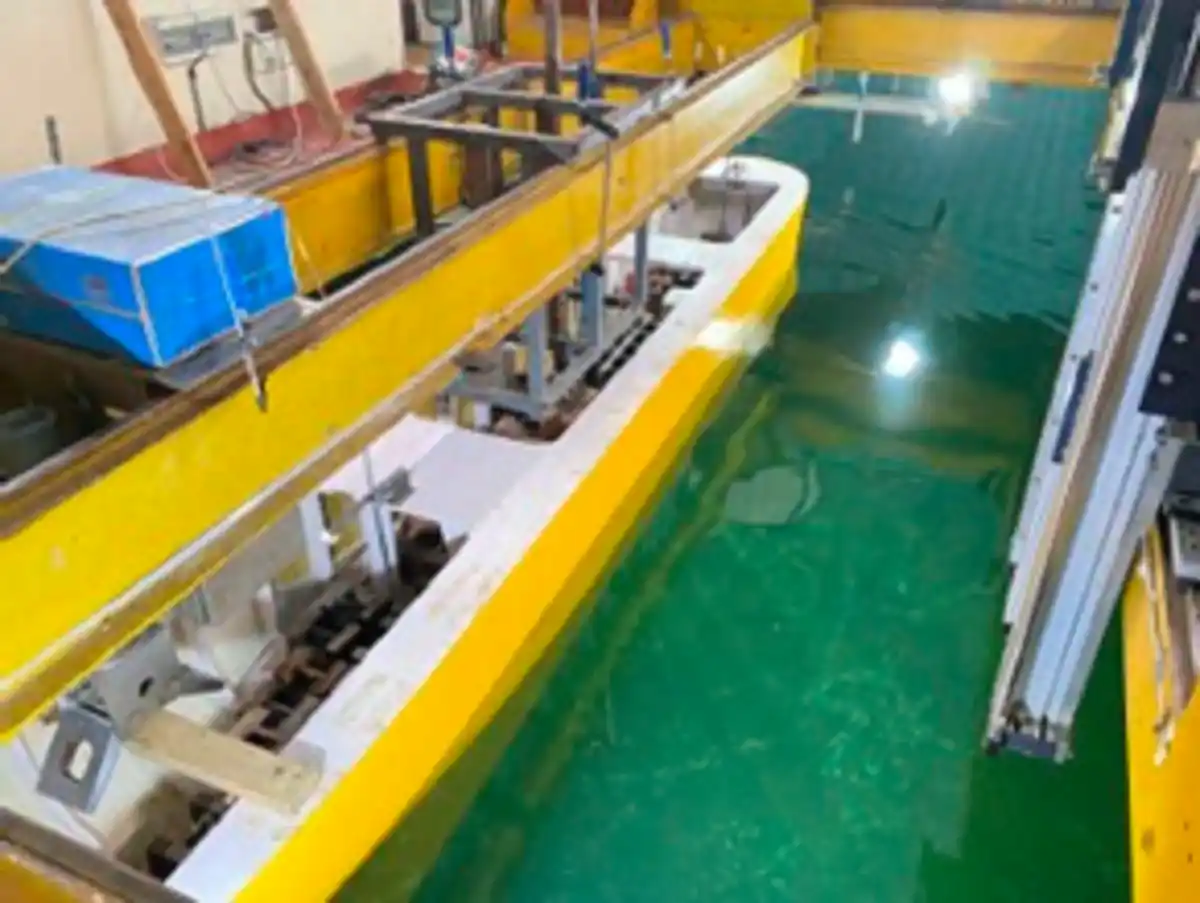
The model is connected to a resistance dynamometer through a towing arrangement designed to measure the longitudinal force without imposing unintended constraints. Depending on the test objective, heave and pitch may remain free so that dynamic sinkage and trim can develop. Sway, yaw, and roll are normally restrained or carefully controlled during a straight-ahead resistance test. The towing point should be selected and documented because an inappropriate vertical or longitudinal position can create a parasitic moment.
3.3 Measurements and instrumentation
The minimum measurement set normally includes model resistance, carriage speed, water temperature, and either fore-and-aft vertical motions or equivalent sinkage and trim. Water temperature is not a secondary environmental detail: it affects density and, more importantly, kinematic viscosity, which enters the Reynolds number and the frictional-resistance correction. Where available, wave probes, photography, pressure taps, or optical velocity measurements can provide additional validation quantities.
- Resistance dynamometer or calibrated load cell
- Carriage-speed measurement
- Fore and aft sinkage transducers, or direct sinkage and trim sensors
- Water-temperature measurement and associated fluid properties
- Signal conditioning and data-acquisition system
- Optional wave elevation, pressure, PIV, LDV, or flow-visualisation measurements
3.4 Calibration, repeats, and data acquisition
The dynamometer, speed system, motion transducers, thermometer, signal-conditioning chain, and data-acquisition system should be calibrated or checked within an appropriate interval. The resistance signal is recorded over the steady portion of the run, filtered where justified, and averaged using a clearly stated procedure. Repeat runs are essential for assessing precision and identifying drift, outliers, or a facility condition that has not fully returned to calm water [2-4].
A complete report should identify the model and loading condition, scale, hydrostatics, turbulence stimulation, towing point, facility dimensions, water properties, form factor, measured resistance, sinkage, trim, and any applied correction. ITTC also links resistance-test reporting to experimental uncertainty analysis and to the use of recognised benchmark data [2].
3.5 Blockage and finite-depth effects
A towing tank is not an infinite ocean. The hull displaces flow within a confined cross-section, and the walls and bottom can increase local velocities, alter pressure, and modify the wave system. The relevance of blockage depends on the model cross-section, tank dimensions, speed, and water depth. The preferred approach is to select a model and test condition that make these effects negligible. When they are not negligible, the correction method and its uncertainty must be documented rather than treated as an invisible post-processing step [2,10].
From Measured Force to Hydrodynamic Coefficients
4.1 Total resistance coefficient
The measured longitudinal force is converted into a non-dimensional total-resistance coefficient so that tests at different speeds, scales, and loading conditions can be compared:
RT is total resistance, ρ is water density, V is model speed, and S is wetted surface area.
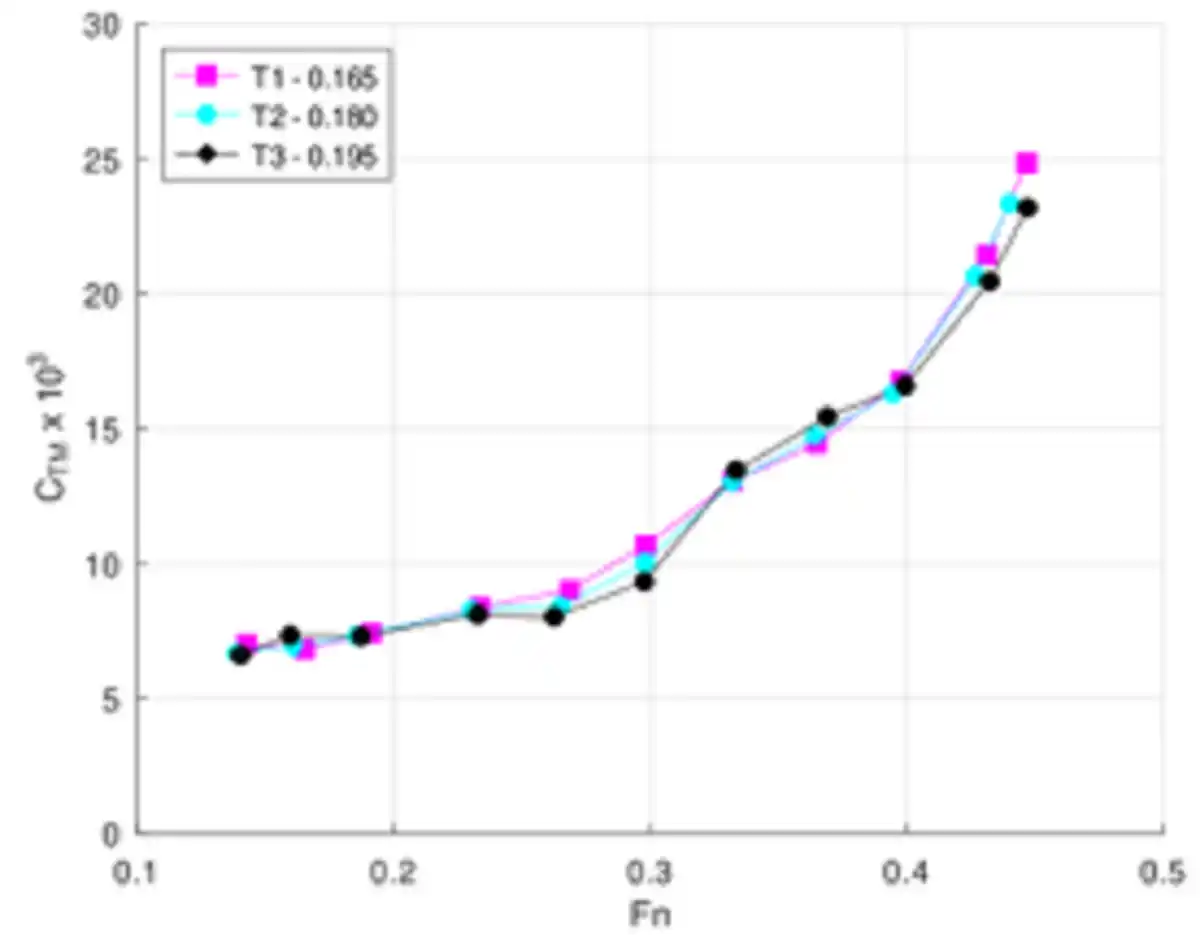
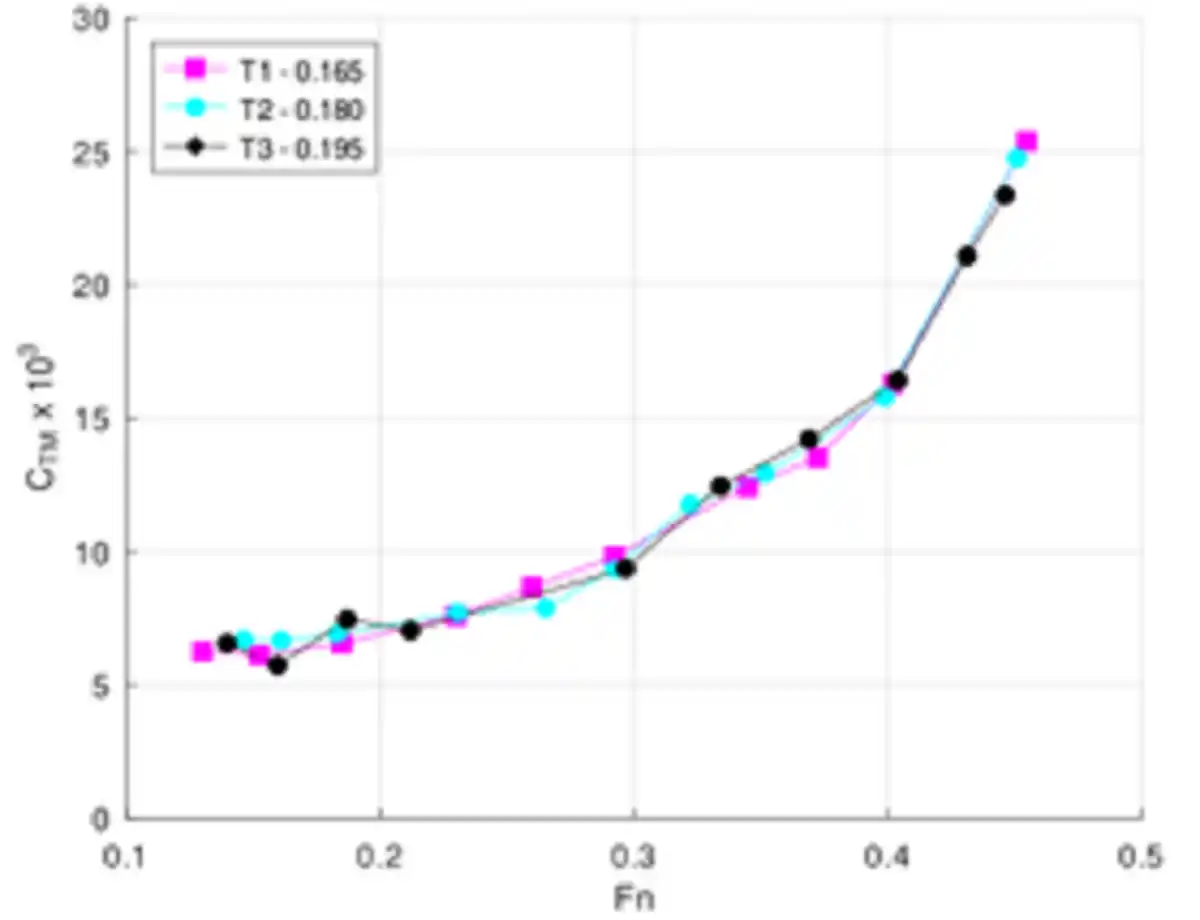
Plotting CT against Froude number produces a compact representation of the resistance curve. The result often reveals changes in the wave-making regime more clearly than a dimensional force-speed plot, particularly when comparing related hulls or loading conditions.
4.2 Froude number and free-surface similarity
Froude number compares inertia with gravity and governs the principal scale of the free-surface wave system.
For a model and ship operating at corresponding speeds, Froude numbers are matched. This preserves the dominant relationship between hull speed, gravity, and characteristic length. The corresponding full-scale speed is therefore obtained from the square root of the geometric scale ratio.
4.3 Reynolds number and viscous flow
Reynolds number compares inertia with viscosity; ν is the kinematic viscosity of water.
The Reynolds number controls boundary-layer development, wall shear, transition, and aspects of separation. Because the model is smaller and slower than the ship, its Reynolds number is much lower even when Froude similarity is satisfied. This is the physical reason a model resistance cannot be converted to full scale by a simple force ratio.
4.4 Friction line and form factor
The ITTC-1957 model-ship correlation line is widely used to estimate the frictional coefficient of an equivalent smooth flat plate:
The relation is an engineering correlation, not a direct measurement of the complete three-dimensional viscous resistance of the hull.
A common three-dimensional decomposition introduces the form factor k:
CR is the residual component in the selected extrapolation framework.
The factor (1 + k) accounts for the increase in viscous resistance caused by hull form compared with the flat-plate estimate. In classical model-test practice, k is often determined at low Froude numbers using Prohaska-type regression. The result depends on the selected speed range, the friction line, the experimental uncertainty, and the validity of the assumed low-speed relationship. Combined CFD/EFD methods can instead estimate the form factor from double-body RANS calculations, but those calculations require their own verification and validation [10,11].
Why Scale Effects Cannot Be Eliminated
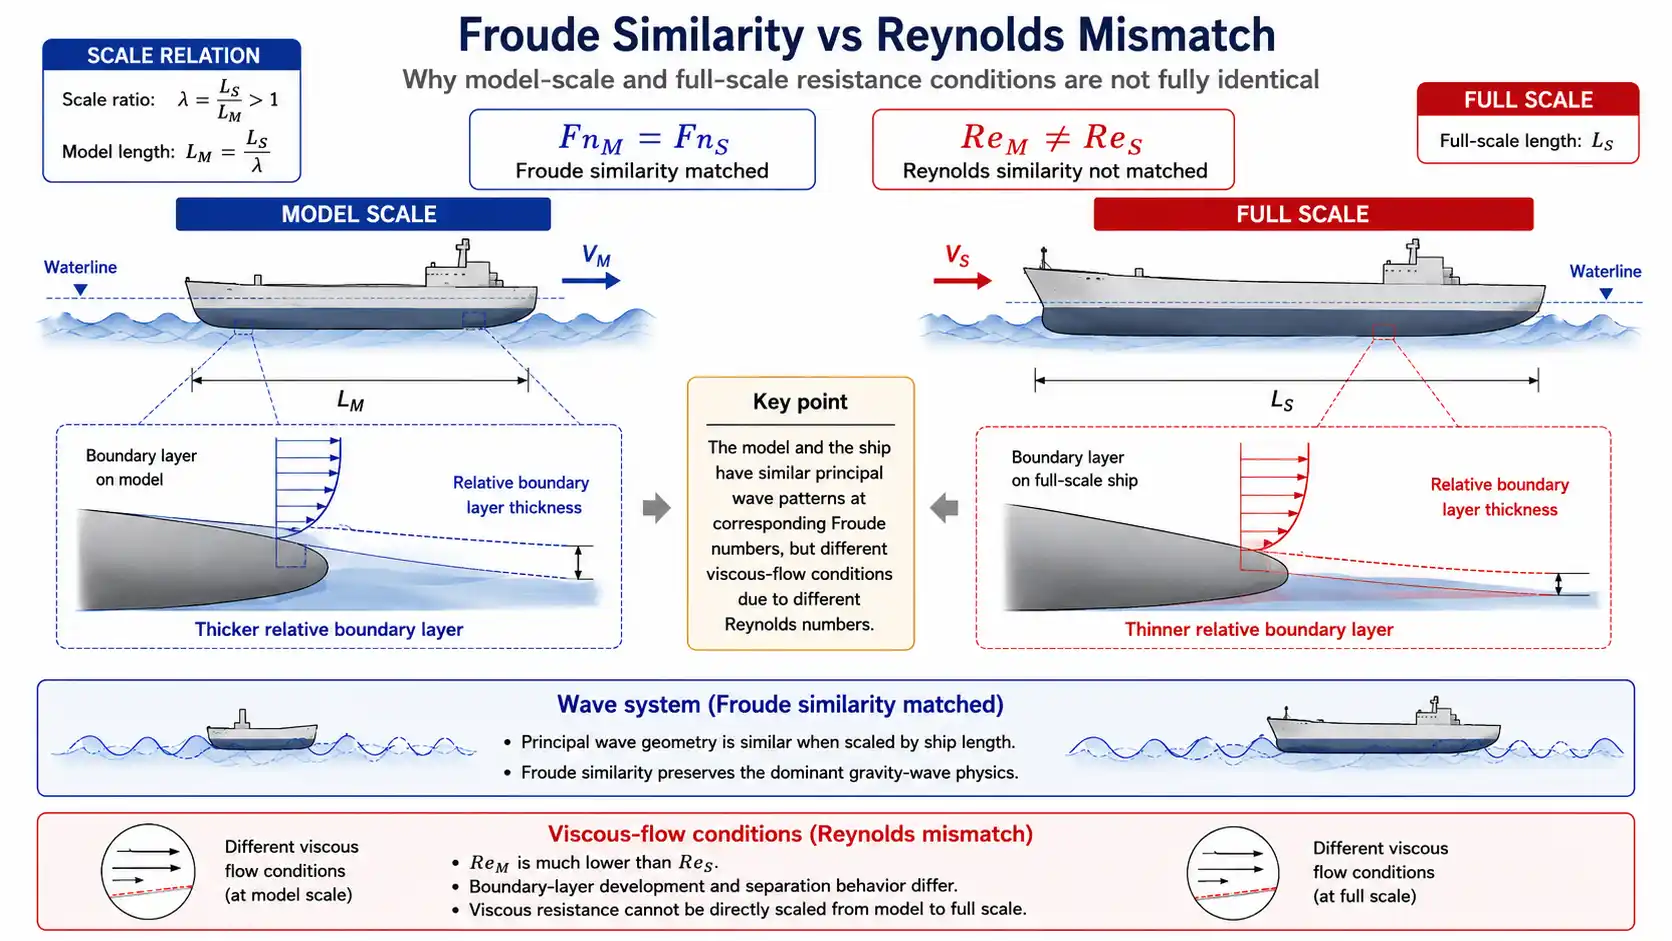
5.1 The Froude-Reynolds conflict
The central scaling problem can be expressed in two statements. First, the model and ship are tested at equal Froude number to preserve the dominant wave physics:
Second, at the same time, their Reynolds numbers are unequal:
The same water cannot simultaneously satisfy both similarity conditions for a geometrically scaled model at practical tank speeds. Froude similarity is therefore imposed, while viscous differences are corrected or modelled. Scale effect is not an experimental mistake; it is a fundamental consequence of using a reduced model for a flow governed by both gravity and viscosity.
5.2 Consequences for the boundary layer and resistance components
Relative to hull length, the model boundary layer is thicker than the full-scale boundary layer. The friction coefficient is higher, the viscous-pressure contribution can differ, and the onset or extent of separation may change. The model may also exhibit different wave breaking, stern flow, transom behaviour, and interaction between the boundary layer and free surface. These differences affect the form factor and the inferred division between frictional, viscous-pressure, and wave-related resistance.
Scale effects are especially important for full-form ships because their resistance contains a strong viscous-pressure contribution and their stern flows can be sensitive to Reynolds number. Guo et al. compared a small towing-tank model with a much larger geometrically similar model tested in a harbour basin. Their study demonstrates that the selected friction line and extrapolation framework can alter the interpreted resistance components, even when the same underlying measurements are used [12].
5.3 Model size as an experimental compromise
A small model reduces blockage and is easier to manufacture and handle, but it produces lower forces and a lower Reynolds number. Small absolute errors in force, speed, mass, or wetted area may then become large relative errors after extrapolation. A larger model improves force resolution and Reynolds-number proximity but demands more tank cross-section, more carriage power, and greater control of finite-depth, wall, and wave-reflection effects. Model selection should therefore be treated as part of uncertainty management, not merely as a geometric convenience.
Experimental Uncertainty: How Reliable Is the Test Result?
6.1 A measured value is not an exact value
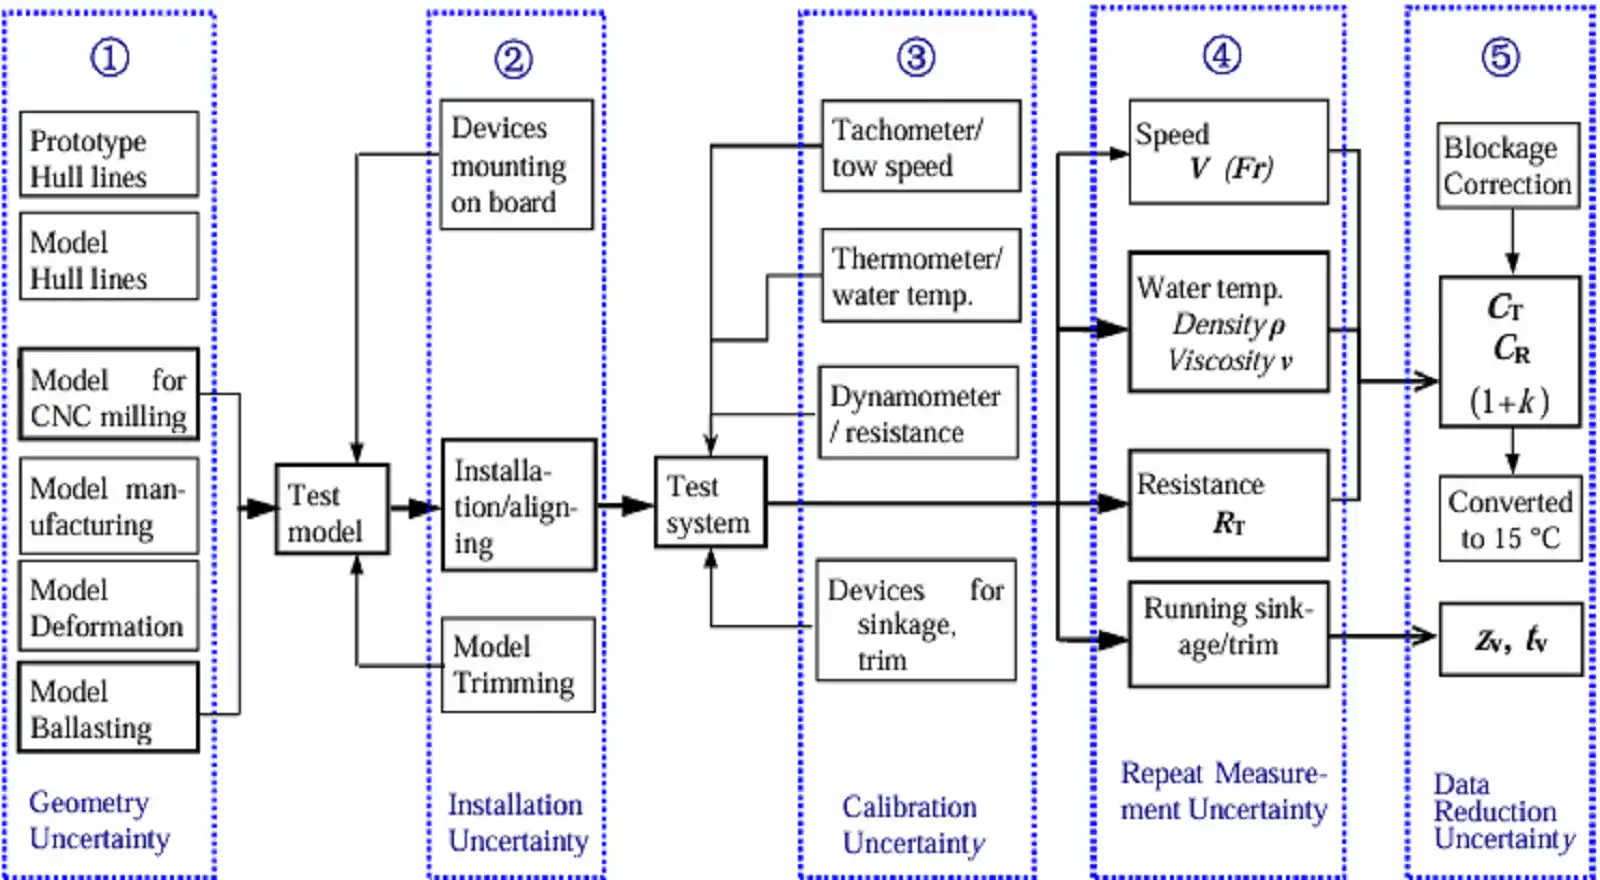
A resistance result is an estimate of a measurand, not an exact physical constant. Its quality depends on the measurement chain and on the assumptions used to convert direct readings into derived quantities such as Froude number, Reynolds number, total resistance coefficient, friction coefficient, sinkage, and trim. A technically complete result therefore combines the best estimate with an uncertainty statement [3,4].
6.2 Main sources of uncertainty
The ITTC resistance-test guideline organises the principal uncertainty sources into model geometry, test installation, instrument calibration, direct measurement, and data reduction [4]. For a typical test, the most influential contributions may include:
- Model displacement, representative length, draught, and wetted surface area
- Alignment, towing-point position, ballast, and installation repeatability
- Dynamometer calibration, linearity, zero drift, and signal conditioning
- Carriage-speed measurement and stability during the averaging interval
- Water temperature, density, and viscosity
- Sinkage and trim measurement
- Repeat-run scatter and residual facility disturbances
- Blockage, finite-depth, and data-reduction corrections
6.3 Type A and Type B evaluation
Type A uncertainty is evaluated statistically from repeated observations. If a nominally identical resistance run is repeated, the scatter provides evidence about precision. Type B uncertainty is evaluated from other information, including calibration certificates, manufacturer specifications, resolution, prior measurements, and engineering judgement. The two categories describe the method of evaluation, not whether a source is random or systematic [3].
6.4 Propagation to derived quantities
Because CT, Fn, and Re are functions of several measured inputs, uncertainty must be propagated through the relevant equations. For an output y that depends on inputs xi, the combined standard uncertainty is commonly expressed in first-order form as
Covariance terms are also required when input quantities are correlated.
The expanded uncertainty U is obtained by multiplying the combined standard uncertainty by an appropriate coverage factor. The final resistance coefficient should then be reported as an estimate plus or minus its expanded uncertainty, together with the coverage basis and the principal contributors.
6.5 Why uncertainty changes interpretation
Two CFD predictions may differ from the experimental mean by the same percentage, yet have different validation implications if the test uncertainties differ. Likewise, an apparently smooth resistance curve may contain points whose uncertainty is dominated by low force level, temperature sensitivity, or repeatability. Oyuela et al. explicitly combined uncertainty contributions from hull geometry, speed, water temperature, dynamometer calibration, and replicate testing in an open-access resistance study, providing a useful example of uncertainty as part of the result rather than an appendix [10].
Virtual Towing Tanks: Reproducing the Experiment in CFD
7.1 Numerical representation of the test
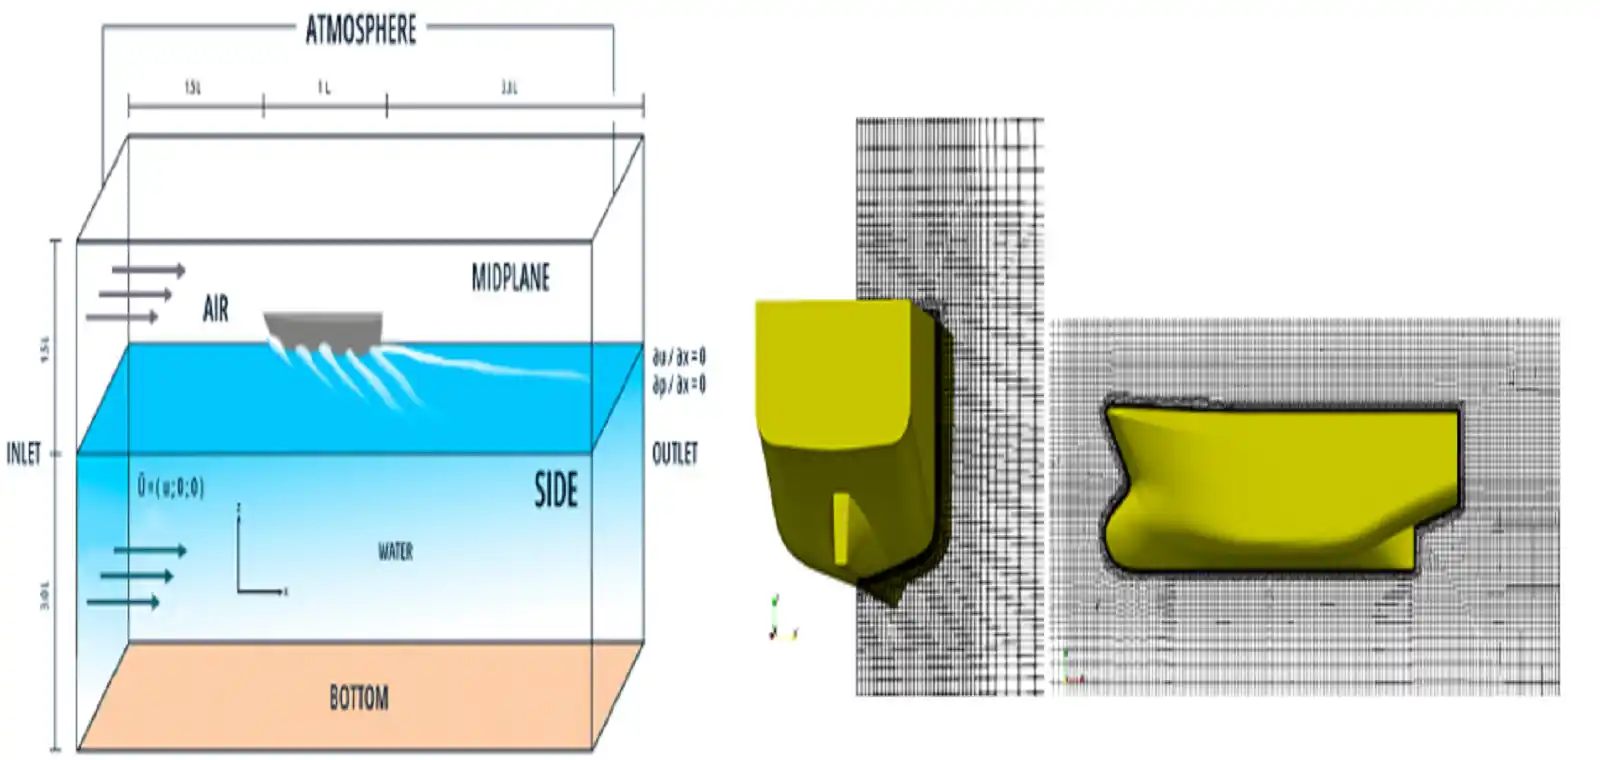
A virtual towing tank reproduces the physical test in a computational domain. The hull is commonly held fixed while water and air enter the domain at the model speed; the equivalent moving-body problem is obtained in the ship-fixed reference frame. Gravity is included, the air-water interface is captured, and the no-slip condition is applied to the wetted hull. When sinkage and trim are free, the rigid-body motion equations are coupled to the flow solution.
Most practical resistance calculations use incompressible RANS or URANS equations with a turbulence model and a Volume of Fluid method for the free surface. The numerical setup should correspond as closely as possible to the experimental geometry, draught, speed, fluid properties, and permitted degrees of freedom. A CFD calculation intended to validate a towing-tank test should not quietly represent a different physical problem.
7.2 Computational domain and boundary conditions
The inlet must be sufficiently far upstream to provide the intended flow before it reaches the bow. The outlet and side boundaries must be distant enough to limit interference, and the downstream region must allow the wave system and wake to develop. The top boundary represents the atmosphere, the bottom and sides are assigned boundary conditions consistent with the intended deep-water approximation, and damping zones may be used to reduce wave reflection. Symmetry is often applied at the centreplane for straight-ahead bare-hull resistance when asymmetric flow is not expected [8,9].
7.3 Grid design and near-wall treatment
A single global cell count does not demonstrate grid quality. Resolution must be concentrated where the solution contains steep gradients: the bow, stern, free surface, hull boundary layer, transom, wake, and wave field. Prism or hexahedral layers are used at the wall, while anisotropic refinement is often efficient near the free surface. Growth ratio, non-orthogonality, skewness, aspect ratio, surface representation, and continuity between refinement zones all affect numerical error.
The target y+ must be consistent with the turbulence model and wall treatment. A wall-resolved approach and a wall-function approach require different first-cell heights and different expectations for the near-wall velocity profile. Reporting only a mean y+ is inadequate if substantial parts of the hull lie outside the intended range.
7.4 Free surface, time step, and convergence
Free-surface simulations are sensitive to interface compression, convection schemes, time step, and local Courant number. Excessive numerical diffusion damps the wave system, while an unstable interface treatment creates spurious oscillation. The resistance signal should be monitored over physical time, and the reported value should be based on a converged or statistically stationary interval. Sinkage and trim histories are equally important when rigid-body motion is active [8,9,15].
Verification: Is the Numerical Solution Sufficiently Resolved?
8.1 Verification before validation
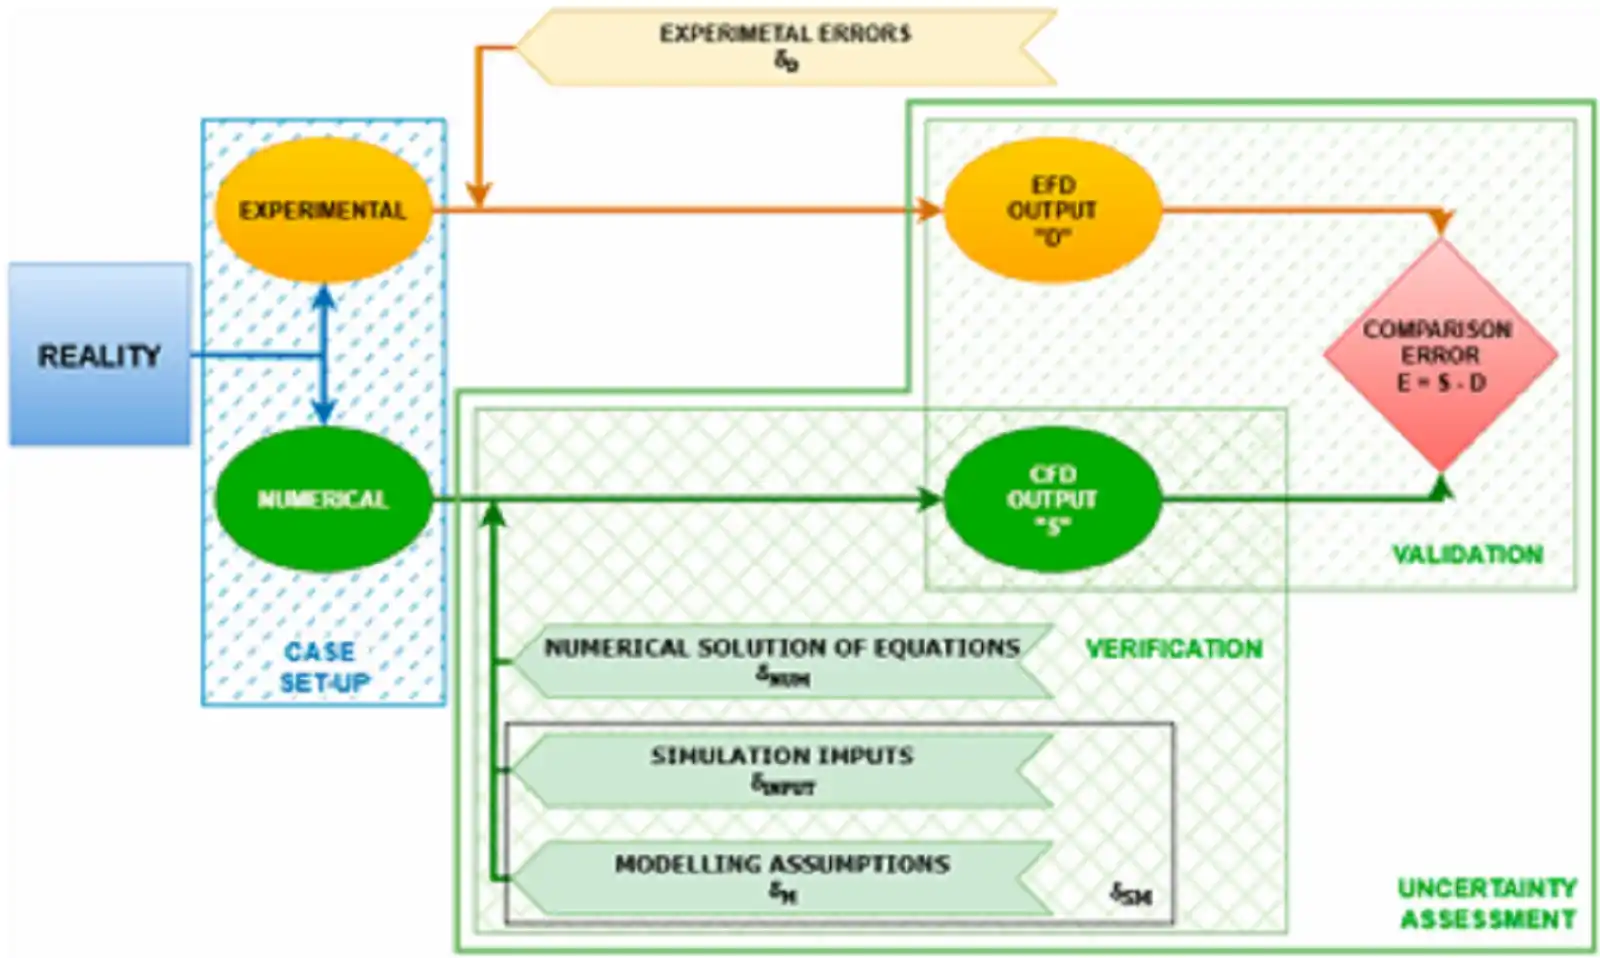
Verification assesses the numerical solution process. It asks whether the mathematical model has been solved with sufficiently controlled numerical error for the stated objective. Validation asks a different question: whether the mathematical model represents the physical experiment with adequate fidelity. Comparing one CFD result with one experimental point before verifying the numerical solution confounds numerical error with modelling error [5].
8.2 Iterative convergence
Residuals, force histories, mass imbalance, and motion histories should be examined. A low residual does not guarantee force convergence, and a steady mean resistance may conceal persistent oscillation or drift. The averaging interval and any filtering must be documented. For unsteady calculations, the solution should be advanced long enough for initial transients to leave the region of interest and for representative statistics to be obtained.
8.3 Grid-convergence study
A systematic spatial study normally uses at least three grids – coarse, medium, and fine – generated with a consistent refinement strategy. The refinement ratio, characteristic grid size, solution values, observed convergence behaviour, and estimated numerical uncertainty should be reported. Monotonic convergence is convenient but not guaranteed; oscillatory or divergent behaviour requires careful interpretation rather than selective reporting of the most favourable grid [5,6,14].
8.4 Time-step sensitivity
Temporal resolution affects free-surface transport, rigid-body motion, pressure fluctuations, and force averaging. A grid study performed at one poorly resolved time step does not isolate spatial error. Where time-dependent effects are material, the time step should be refined systematically and the numerical uncertainty associated with temporal discretisation should be assessed.
8.5 Numerical uncertainty methods
The current ITTC VVUA procedure summarises practical methods based on Stern and on Eça and Hoekstra. These approaches estimate observed order, extrapolated solution, and numerical uncertainty from systematically refined solutions. Their assumptions and data requirements differ, and the outcome can be sensitive to the selected solution set. Bozzo et al. compared several uncertainty approaches for virtual towing-tank resistance predictions and showed that method choice and outlier treatment can materially change the reported uncertainty [5,14].
Validation: Does CFD Reproduce the Physical Test?
9.1 Integral and local validation quantities
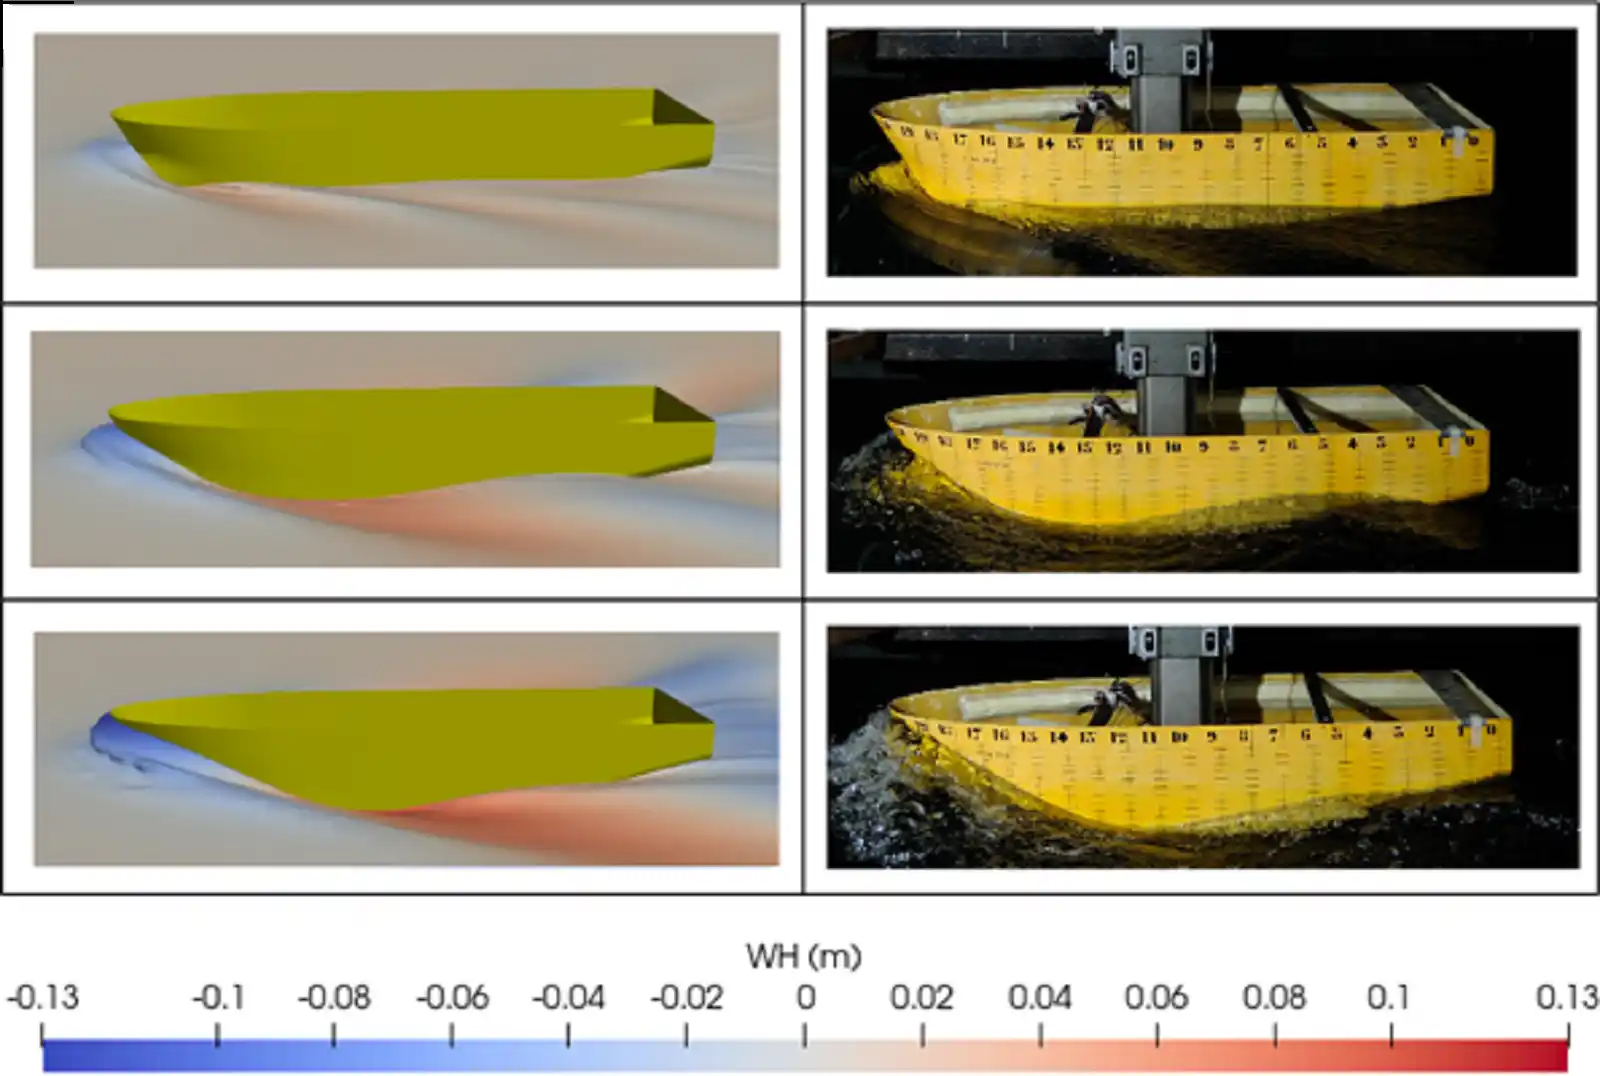
The most common validation quantity is total resistance, but it should not be the only one when additional data are available. Sinkage and trim test the force and moment balance. Wave cuts and wave-field images test free-surface prediction. Hull pressures test local loading. Velocity profiles and wake measurements test viscous-flow structure. Agreement across several independent quantities is stronger evidence than agreement in one integrated coefficient.
- Total resistance RT and coefficient CT
- Dynamic sinkage and trim
- Wave elevation along the hull and in transverse or longitudinal cuts
- Free-surface pattern and wave-breaking location
- Hull-pressure distribution
- Skin-friction or wall-shear distribution where measurable
- Velocity and turbulence quantities in selected planes or the wake
9.2 Comparison error is not the whole validation result
S is the simulation result and D is the experimental value.
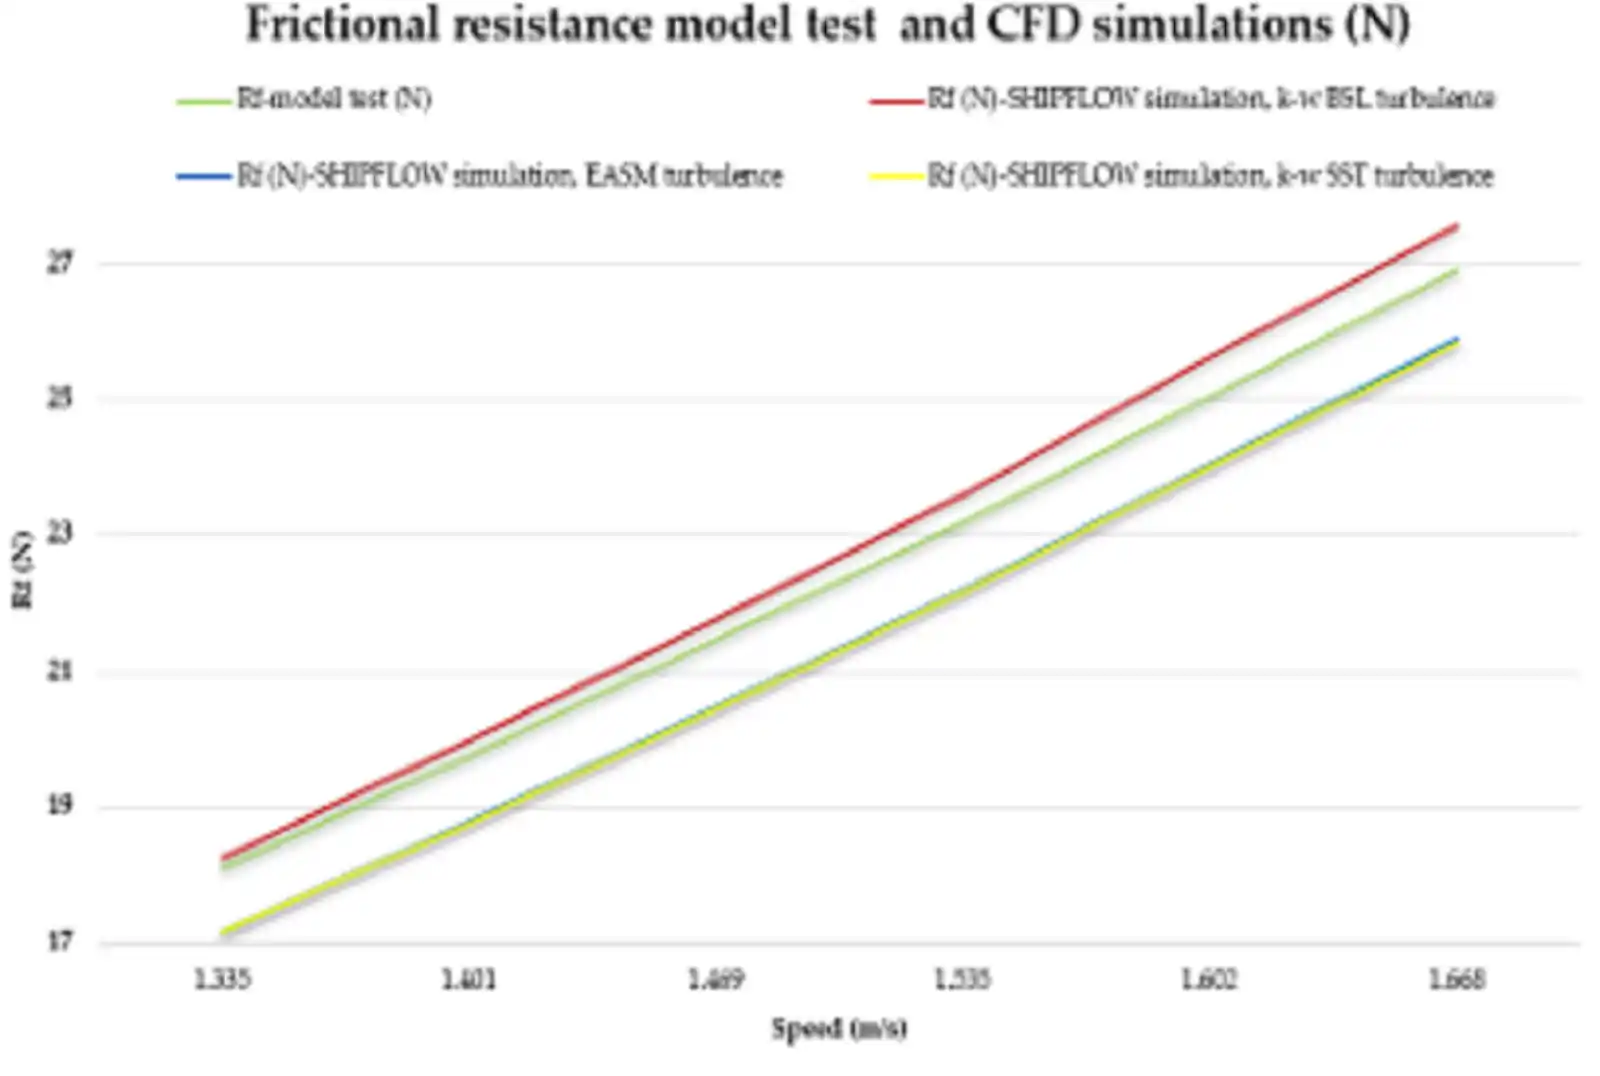
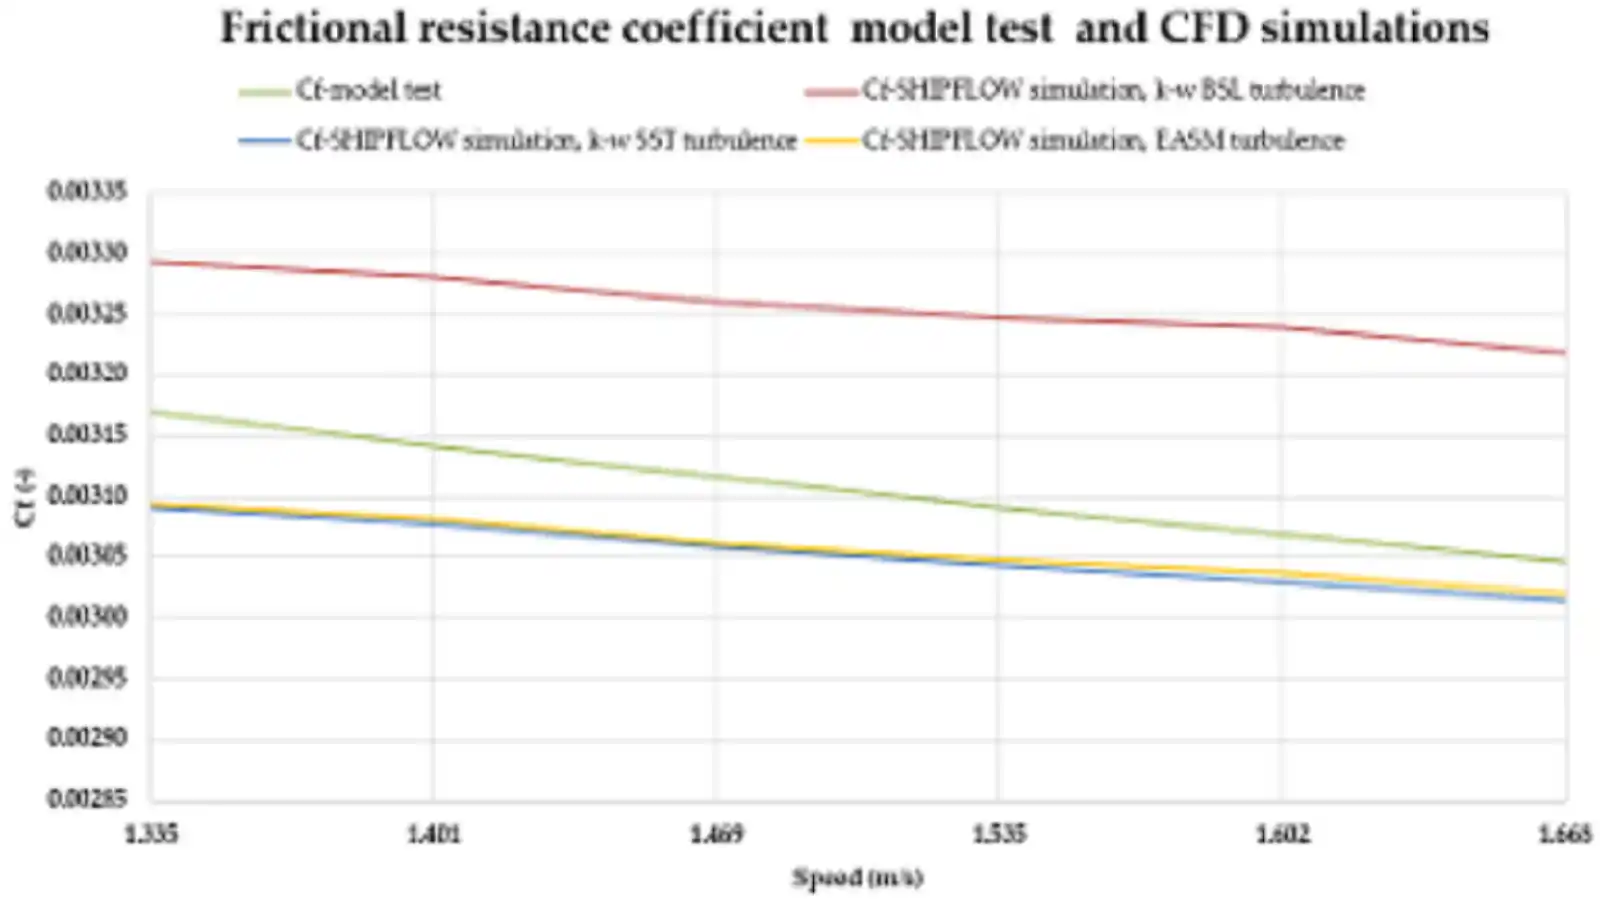
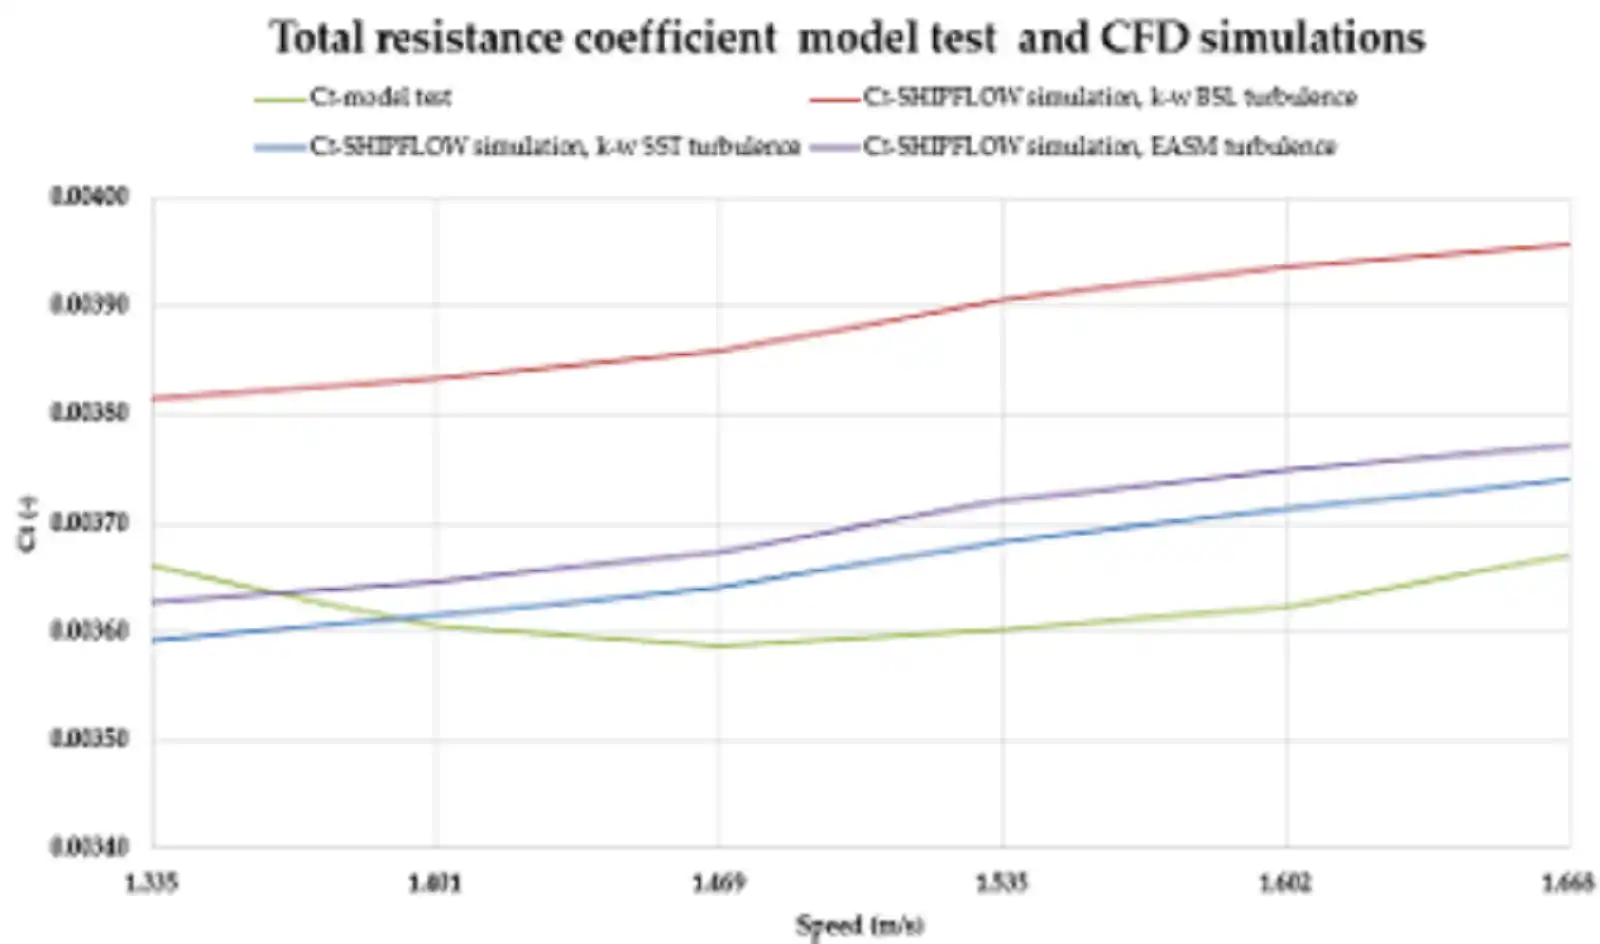
A percentage difference is useful for communication, but it does not identify why the results differ and does not account for uncertainty. Validation combines the comparison error with numerical uncertainty and experimental uncertainty. If the comparison error is larger than can reasonably be explained by those uncertainties, the result indicates a modelling deficiency, a mismatched test condition, or an unrecognised source of error. If the error lies within the validation uncertainty, the available evidence does not demonstrate a significant discrepancy at that uncertainty level [5,6].
9.3 Avoiding false confidence through error cancellation
A close total-resistance value can be produced by compensating errors. A CFD model may overpredict pressure resistance and underpredict frictional resistance, or reproduce the force while damping the wave system. This is why field quantities matter. Oyuela et al. compared EFD and CFD resistance curves and wave patterns for a fishing vessel, while Chiroșcă and Rusu compared a public container-ship benchmark across several CFD packages. These studies illustrate both the value of integrated force comparison and the additional insight gained from wave, pressure, motion, and multi-code evidence [10,13].
Benchmark Hulls and Public Validation Data
Validation depends on traceable reference data. A benchmark case should provide the hull geometry, loading condition, scale, fluid properties, test speed, facility information, measurement definitions, and uncertainty or sufficient information to assess it. A resistance value copied from an unattributed plot is not a robust validation dataset.
The ITTC benchmark database organises public or widely used surface-ship cases by vessel type, facility, and test category. Common examples include the KRISO Container Ship (KCS), the KVLCC2 tanker, the Duisburg Test Case (DTC), DTMB 5415, and REGAL. Their value lies not only in availability but in repeated use across workshops, facilities, and CFD codes, which makes systematic comparison possible [7].
| Benchmark | Vessel type | Primary relevance to this review |
|---|---|---|
| KCS | Container ship | Resistance, sinkage, trim, wave pattern, and workshop comparisons |
| KVLCC2 | Full-form tanker | Viscous-flow behaviour, stern flow, and scale sensitivity |
| DTC | Container ship | Public geometry and multi-code resistance comparison |
| DTMB 5415 | Surface combatant | Resistance and detailed flow-field validation |
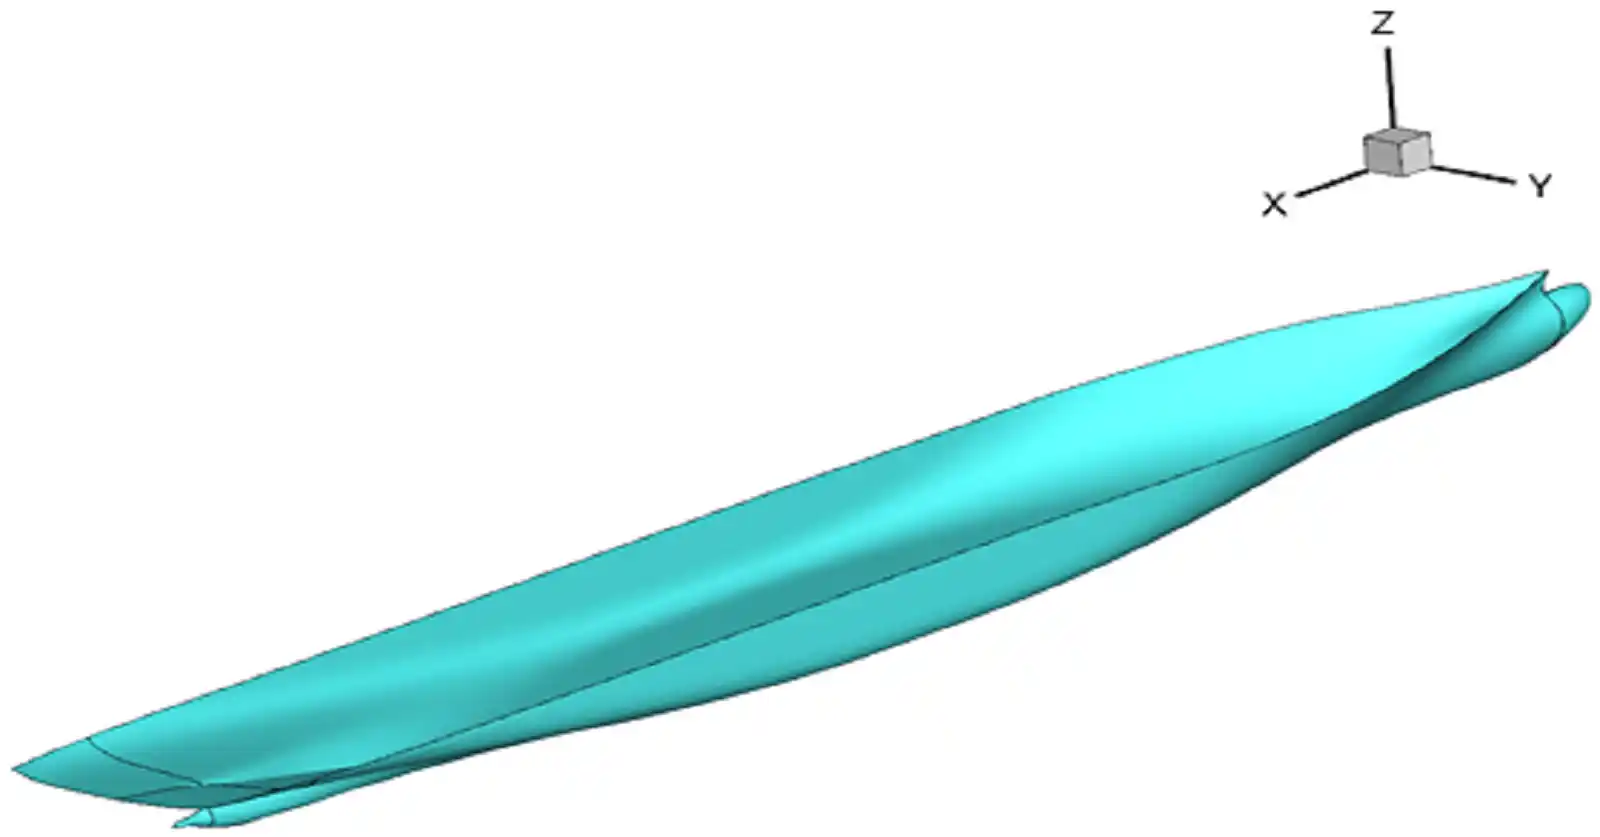
For a web review, one benchmark should be used as a compact case study rather than presenting a catalogue of hulls. DTC is suitable because its geometry and resistance-test results are publicly available and have been reproduced using several CFD packages [13]. KCS and KVLCC2 can then be cited as broader examples of internationally established validation cases.
What the Current Evidence Shows
11.1 Towing tanks remain the physical reference
A controlled model test directly measures the response of water, gravity, and the physical hull under documented conditions. Its strengths are traceability, repeatability, and the ability to expose deficiencies in numerical models. Its limitations are cost, facility access, finite scale, restricted measurement coverage, and the need to extrapolate viscous effects.
11.2 CFD provides a wider hydrodynamic picture
A validated CFD model can provide hull-pressure contours, skin-friction distribution, limiting wall streamlines, free-surface elevation, velocity fields, vorticity, and coherent-structure visualisation throughout the computational domain [9]. This information can help explain why a resistance curve changes with speed, draught, or hull modification. It also allows virtual interrogation at locations where a physical sensor would disturb the flow or be impractical.
11.3 Numerical choices can alter the answer
The turbulence model, convection scheme, gradient scheme, temporal discretisation, wall treatment, free-surface method, grid topology, and domain dimensions are not neutral implementation details. Grlj et al. demonstrated that numerical choices affect resistance, wave pattern, sinkage, and trim at both model and full scale. Their results also illustrate that a setup producing a similar mean resistance can still produce a different wave field or convergence behaviour [15].
11.4 EFD and CFD are complementary
The strongest workflow does not ask whether CFD should replace towing tanks. It asks which physical measurements are needed to establish credibility, which numerical results extend the interpretation, and how uncertainty from both methods can be combined. EFD anchors the analysis in reality; CFD fills the spatial gaps and permits controlled numerical variation. Combined CFD/EFD approaches are particularly promising for form-factor estimation and for diagnosing the physical origin of resistance differences [10,11].
A visually detailed CFD result is not evidence of accuracy by itself, and a towing-tank value is not complete without uncertainty and scale-aware interpretation. Credible resistance prediction is produced by linking the two methods through verification, validation, and transparent reporting.
Best-Practice Workflow for Calm-Water Resistance Prediction
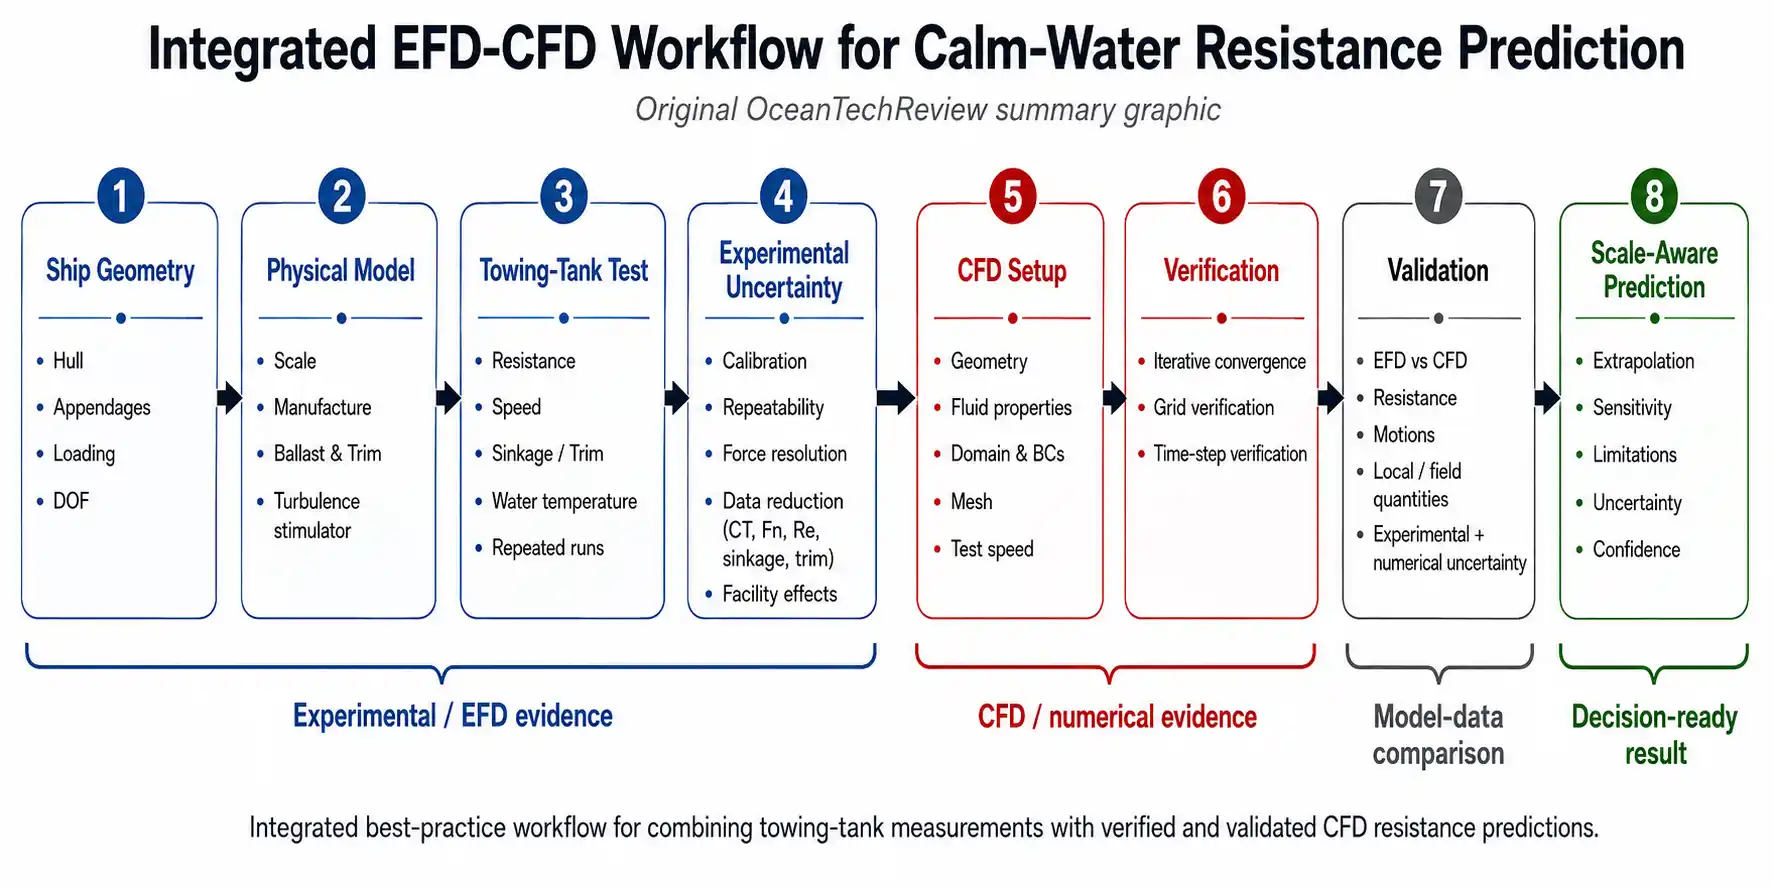
- Define the hull, appendage condition, loading condition, degrees of freedom, speed range, and validation quantities.
- Select a model scale compatible with tank width, depth, run length, carriage capability, blockage limits, and force resolution.
- Manufacture, inspect, document, ballast, and trim the model; install an appropriate turbulence stimulator.
- Calibrate resistance, speed, motion, temperature, and data-acquisition systems.
- Conduct repeated resistance runs over the prescribed Froude-number range and quantify experimental uncertainty.
- Reduce the data to CT, Fn, Re, sinkage, trim, and any required extrapolation quantities using declared equations and corrections.
- Construct a CFD case that reproduces the physical geometry, loading condition, fluid properties, degrees of freedom, and test speed.
- Demonstrate iterative convergence and perform systematic grid and time-step verification.
- Validate resistance, motions, and local or field quantities against experimental data while accounting for both numerical and experimental uncertainty.
- Report the complete evidence chain, including limitations, sensitivity, uncertainty, and the exact basis for any claim of agreement.
Conclusions
Model-scale towing-tank testing remains the physical foundation of calm-water ship-resistance prediction. A well-conducted experiment measures more than a towing force: it defines a controlled loading condition, records sinkage and trim, establishes fluid properties, manages facility effects, and reports uncertainty. Those elements determine whether the result can support design decisions or numerical validation.
Scale effects cannot be eliminated because Froude and Reynolds similarity cannot be satisfied simultaneously in an ordinary model test. Matching Froude number preserves the principal free-surface wave physics, while the Reynolds-number mismatch changes boundary-layer development and viscous resistance. Friction lines, form factors, turbulence stimulation, model size, and extrapolation methods are practical responses to this fundamental incompatibility.
CFD extends the test by resolving pressure, shear, velocity, turbulence, and wave fields across the entire domain. However, that capability is useful only when the numerical solution is verified and the physical model is validated. Grid independence, time-step sensitivity, iterative behaviour, wall treatment, surface resolution, and uncertainty must be part of the evidence, not hidden implementation details.
The most defensible approach is therefore neither purely experimental nor purely computational. It is a combined EFD-CFD workflow in which the towing tank supplies traceable physical data, verification controls numerical error, validation evaluates modelling fidelity, and CFD provides the detailed hydrodynamic interpretation required for modern naval architecture.
Frequently Asked Questions
What is a ship-model towing tank?
A towing tank is a long hydrodynamic test basin in which a geometrically scaled ship model is towed at controlled speeds. A carriage and dynamometer measure resistance, while additional systems record sinkage, trim, water temperature, wave elevation, or flow quantities. The resulting model-scale data are analysed using similarity laws and established extrapolation procedures.
Why can Froude and Reynolds similarity not be satisfied simultaneously?
Froude similarity requires speed to scale with the square root of length, whereas Reynolds similarity requires a different relationship involving length, speed, and viscosity. With the same fluid in the model test and at full scale, both conditions cannot be met at practical model dimensions. Towing-tank practice therefore matches Froude number and corrects or models the viscous difference.
Can CFD replace towing-tank testing?
CFD can reduce the number of experiments, support hull-form development, and provide flow details unavailable from routine testing. It does not remove the need for physical evidence when high-confidence prediction is required. A CFD model needs verification and validation, and towing-tank data remain one of the most important validation references for model-scale ship hydrodynamics.
What is the difference between CFD verification and validation?
Verification evaluates numerical error and asks whether the selected mathematical model has been solved accurately enough. Validation compares the verified simulation with experimental reality and evaluates modelling error. A simulation can be numerically well resolved yet physically inaccurate, or physically close to one experiment because of compensating numerical and modelling errors.
References
- International Towing Tank Conference (ITTC), Ship Models, Recommended Procedure 7.5-01-01-01, Revision 05, 2024.
- International Towing Tank Conference (ITTC), Resistance Test, Recommended Procedure 7.5-02-02-01, Revision 05, 2021.
- International Towing Tank Conference (ITTC), Guide to the Expression of Uncertainty in Experimental Hydrodynamics, Recommended Procedure 7.5-02-01-01, Revision 02, 2014.
- International Towing Tank Conference (ITTC), General Guideline for Uncertainty Analysis in Resistance Tests, Recommended Procedure 7.5-02-02-02, Revision 03, 2021.
- International Towing Tank Conference (ITTC), Uncertainty Analysis in CFD Verification and Validation Methodology and Procedures, Recommended Procedure 7.5-03-01-01, Revision 05, 2024.
- International Towing Tank Conference (ITTC), Uncertainty Analysis in CFD, Examples for Resistance and Flow, Recommended Procedure 7.5-03-02-01, Revision 02, 2024.
- International Towing Tank Conference (ITTC), Benchmark Database for CFD Validation for Resistance and Propulsion, Recommended Guideline 7.5-03-02-02, Revision 03, 2024.
- International Towing Tank Conference (ITTC), Practical Guidelines for Ship CFD Applications, Recommended Guideline 7.5-03-02-03, Revision 02, 2024.
- International Towing Tank Conference (ITTC), Practical Guidelines for Ship Resistance CFD, Recommended Guideline 7.5-03-02-04, Revision 02, 2024.
- S. Oyuela, H. R. D. Ojeda, F. P. Arribas, A. D. Otero, and R. Sosa, “Investigating Fishing Vessel Hydrodynamics by Using EFD and CFD Tools, with Focus on Total Ship Resistance and Its Components,” Journal of Marine Science and Engineering, vol. 12, art. 622, 2024. DOI: 10.3390/jmse12040622.
- K. B. Korkmaz, S. Werner, and R. Bensow, “Verification and Validation of CFD Based Form Factors as a Combined CFD/EFD Method,” Journal of Marine Science and Engineering, vol. 9, art. 75, 2021. DOI: 10.3390/jmse9010075.
- C. Guo, X. Zhong, and D. Zhao, “Research on Scale Effect of Resistance Components for Full-Formed Ship Based on Large-Scale Model Towing Test,” Journal of Marine Science and Engineering, vol. 11, art. 1300, 2023. DOI: 10.3390/jmse11071300.
- A.-M. Chiroșcă and L. Rusu, “Comparison between Model Test and Three CFD Studies for a Benchmark Container Ship,” Journal of Marine Science and Engineering, vol. 9, art. 62, 2021. DOI: 10.3390/jmse9010062.
- S. Bozzo, D. Villa, and S. Mancini, “Analyses of Different Approaches for Virtual Towing Tank Uncertainty Assessment,” Journal of Marine Science and Engineering, vol. 13, art. 1882, 2025. DOI: 10.3390/jmse13101882.
- C. G. Grlj, N. Degiuli, and I. Martić, “The Impact of Numerical Parameters on the Resistance Characteristics of a Container Ship at the Model and Full Scale,” Journal of Marine Science and Engineering, vol. 11, art. 1672, 2023. DOI: 10.3390/jmse11091672.
Image licensing and editorial-use notes
The six Journal of Marine Science and Engineering articles cited in references [10]-[15] are published under the Creative Commons Attribution 4.0 International licence (CC BY 4.0). Their figures may be reused or adapted when the source, authors, article, figure number, and licence are clearly credited, and when modifications are identified. Before publication, verify the final caption against the article’s licence statement and preserve any third-party credit included in the original figure.
The ITTC procedures are used here as technical references. For OceanTechReview, diagrams based on ITTC procedures should be redrawn as original editorial artwork rather than reproduced as page images. Equations and technical descriptions should be paraphrased and cited by procedure number.